In modern days, web applications are expected to perform fast and responsive. At the same time, these applications are complex and will require significant effort to analyze performance if we do it manually.
That’s why we should search for better tools to reduce the effort. When it comes to React, the React profiler is something you should definitely checkout.
Once you learn how to effectively use this Chrome DevTools plugin, it’ll be a piece of cake to identify performance issues in your React application! 😊
Introduction to React Profiler
If your application is using React 16.5 or above, it will support the new DevTools Profiler plugin. You can view the Profiler tab in DevTools. I’ll be using the Chrome browser for referencing in this article.
Pre-requisites:
- The application should have React version 16.5 or above.
- The React DevTools Extension needs to be installed in your browser.

If your application supports React Profiler, you can see the above initial screen in DevTools under the ⚛ Profiler tab.
This uses React’s experimental Profiler API to collect timing information of each component render. We can identify any performance bottlenecks using that information.
The Profiler tab is very convenient as it provides a visual representation of render times and allows navigation through commits while viewing props and states of components. As a result, it allows for faster analysis and investigation of performance issues.
In this article, we’ll be looking at two main topics.
- How do we performance profile a React application?
- How do we interpret the performance data obtained?
Performance Profiling a React application
Profiling a React application is very easy. It involves only 3 steps.
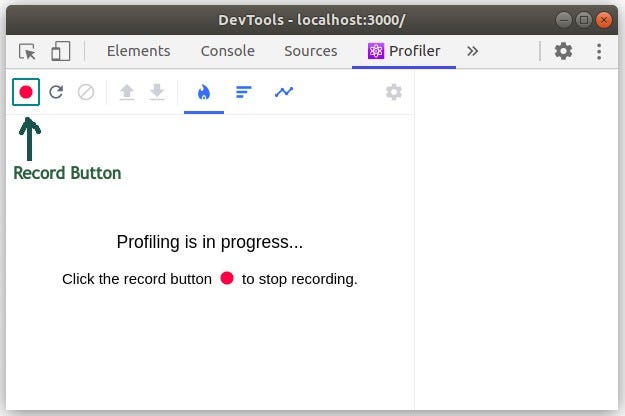
- Click the Record button in the Profiler tab
- Use your application as you usually would. (The Profiler will gather information about application re-renders at this stage)
- Click the Record button again to finish recording (You may also have a separate Stop button to finish recording based on the browser you use).
I have included an image of the Record and Stop button for your reference.

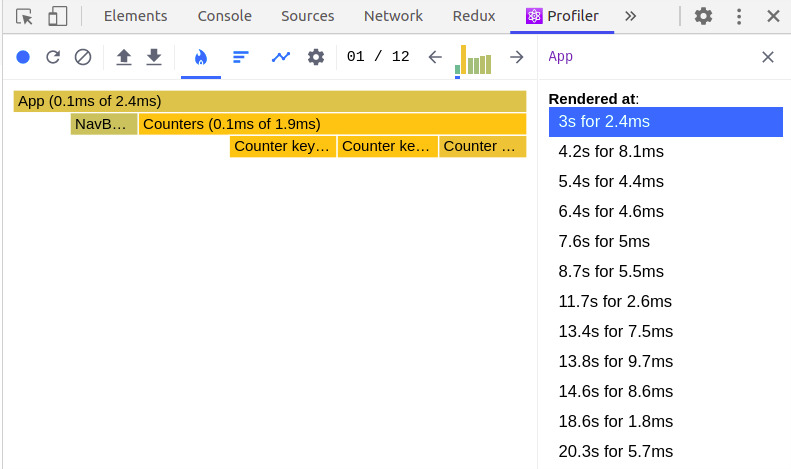
That’s it! This is the output I got for my demo application

Like I said, profiling a React application is very easy. Now let’s see how we can read the performance data we obtained. This is the most critical part, as this would give you a comprehensive performance analysis of your application components.
Tip: Build Great Design Systems and Micro Frontends
Take frontend development to the next level with independent components. Build and collaborate on component-driven apps to easily unlocks Micro Frontends, and to share components.
OSS Tools like Bit offer a great dev experience for building and composing independent components, and build solo or together with your team.

Reading Performance Data
Usually, React works in two phases: the render phase and the commit phase.
While the render phase determines what changes need to be done to the DOM, the commit phase is where the actual difference is applied to the DOM.
The React profiler collects information in the commit phase and groups the performance info by a commit. The commits are displayed in a bar chart as below.

React Profiler provides 4 types of chart views for performance data.
- Flame Chart
- Ranked Chart
- Interaction Chart
- Component Chart
1. Flame Chart
This view represents the state of your application for a single commit. Each bar represents a component, and the bar’s length shows how long it took to render the component. In my example, the Counters component has taken longer to render than the Counter Key component. By clicking on each bar, you can get the specific rendering information for that component for the selected commit on the right detail panel.

Using the bars’ colors, you can get an idea about the time each component took to render. The general colors are as follows.
- Yellow — The component took a lot of time to render
- Blue — The component comparatively took less time to render
- Gray — The component did not render at all during the commit
Using this, you can identify which components are the culprit for the long renders and optimize those components with techniques such as memoization to avoid unnecessary re-renders.
2. Ranked Chart
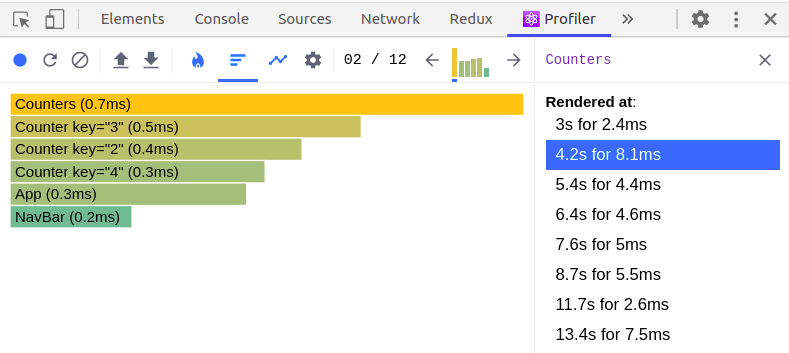
When you click the “Ranked” button in the Profiler tab, you can get the Ranked chart view. This view shows the order of components based on the time they took to render. The components which took more time will be on the top. At a glance, this view gives an idea about which components are the bottlenecks and affects the most for page reloads.

In my demo application, the Counters component has taken the most time to render.
3. Interaction Chart
This is an experimental API that can trace the cause of an update in your application.
For example, if you scroll to a certain position in your application, this would be traced as an interaction and will be displayed in the Profiler tab. The commits related to this interaction will be displayed for each interaction as well.
This was added to React very recently. You can refer to this API here to find out more about it.
4. Component Chart
Double-clicking on a component will allow you to view the component chart. This view will provide information about the component lifecycle during the profiling time. The information is displayed in the form of a bar chart where each bar shows at what time the particular component was rendered and the length of the bar shows for how long it was rendering.
Now that you’ve learned how to read performance data, let’s see what points you should keep an eye out for when using this tool to analyze your applications.
Common Pitfalls to Avoid when using React Profiler in Practice
Measuring Performance on Development vs Production Build
Measuring the performance of your application in development mode may give you sugar-coated results.
In order to get an accurate measurement, you need to profile your application in production mode, as this is what the users would experience.
However, measuring this would not be easy and straight-forward as React has code in it that’s specific to profiling, and they remove it from the production build. As a result, you may see a message saying, “Profiling support requires either a development or production-profiling build of React v16.5+”.
In order to profile the production build of your application, you will have to update your Webpack configuration to alias imports of specific modules to its profiling version. The two aliases you need to add are for the react-dom and scheduler/tracing modules.
The profiling version of these two would be react-dom/profiling and scheduler/tracing-profiling . Once this is done, you will be able to get performance profiled data for your production build as well.
Another factor to keep in mind is that some users might be using devices with limited resources to view the web app. Therefore profiling in a high-end machine would not represent the common use case.
To overcome this you can use Network and CPU throttling in DevTools to check how well your app performs in low-end or mid-end devices.
Problems with React Profiler
Multiple Roots Issue
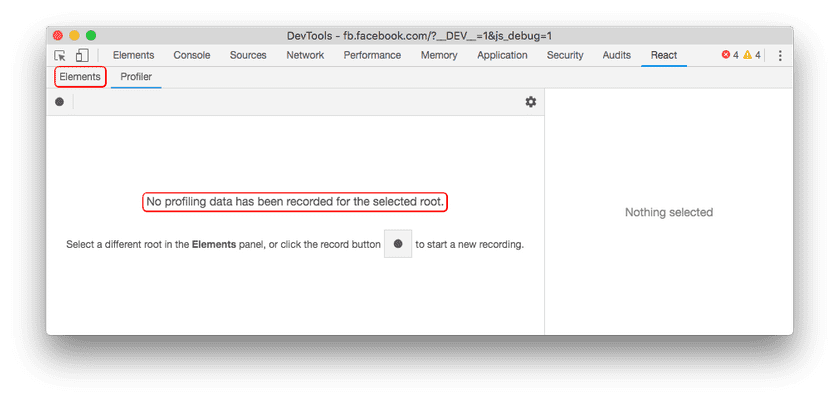
If you have multiple roots in your application, it can lead to an error. The Profiler may display an error saying, “No profiling data has been recorded for the selected root.” You need to select a different root to see whether any data has been recorded for this problem.

Render Thresholds
When a commit is extremely fast, performance.now() does not give the Profiler any meaningful timing information.

Alternatives to React Profiler
The DevTools extension is not the only way you can measure the performance of your application. You can use the <Profiler> React component (React’s Profiler API) in your code to measure performance as well.
Further, you could also use the Chrome DevTools Performance tab or Lighthouse to measure performance in general as well.
The React Profiler’s specialty is that it is customized for React applications and is therefore very convenient over other alternatives.
Summary
The latest addition to React 16.5, the React Profiler, gives developers a convenient way to analyze their React applications’ performance bottlenecks visually. This is one of the most powerful tools to inspect the performance. However, when working with a production bundle, you need to have a few extra configurations to get this to work.
Having access to performance data in your application gives you full control to optimize your application and provide the best user experience.
Thanks for reading!

No comments:
Post a Comment